Scanned Figures, Rebuilt as Working Objects
Full digital reconstruction preserves a figure’s appearance and recovers the structure that makes it work.
We reconstruct scanned technical figures into digital artifacts with their appearance, structure and meaning. Their text is selectable, their data and expressions are editable, and their parts retain relationships that make manipulation possible.
This is a richer form of document digitization: the figure carries an explicit representation of what it contains. Knowledge preserved in reports, manuals and archives becomes material people and software can inspect, adapt and use in new work.
A chart should know what its marks represent
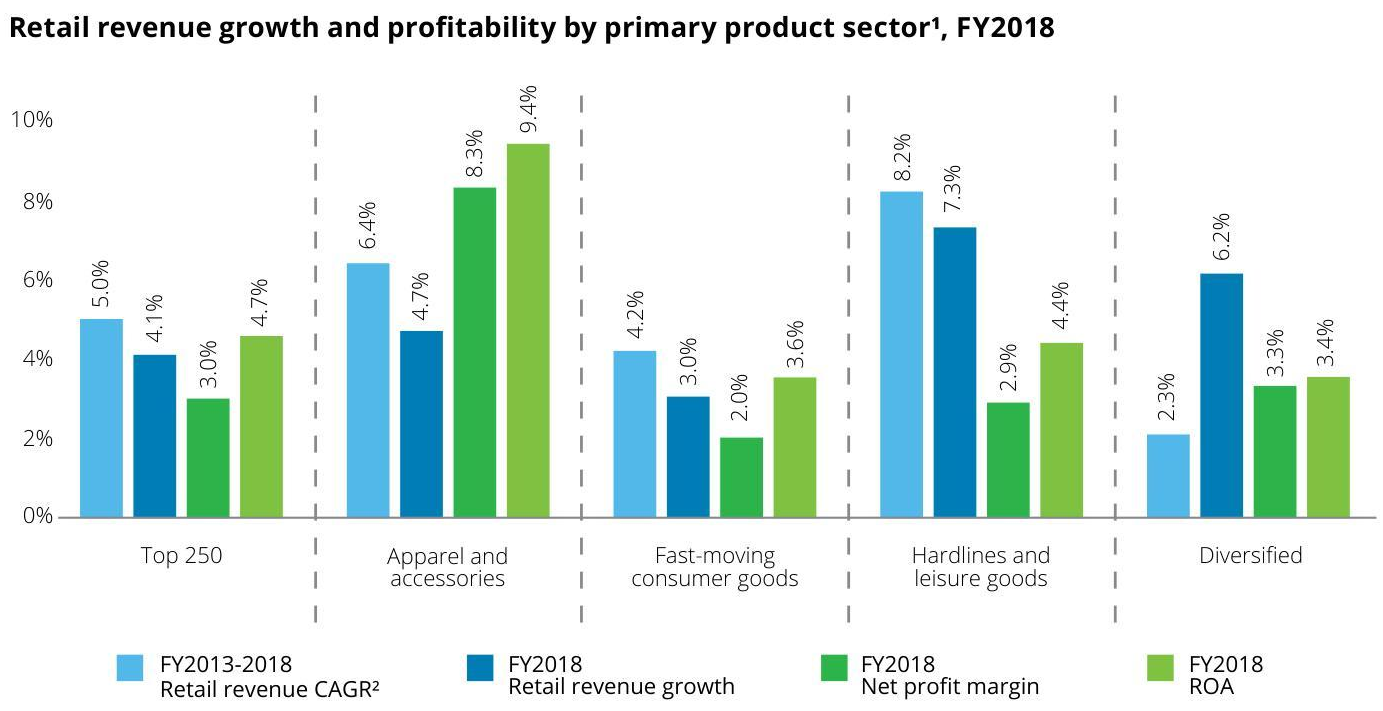
The grouped bar chart carries twenty printed values across four series. Changing the first value from five to six percent updates both the bar and its label. A separate edit starts from the original values and changes the vertical range from minus two to twelve percent, regenerating the marks, ticks and zero reference against the new scale.
That behavior depends on how we represent the figure. The value belongs to the data, and the chart renderer uses it to position the mark and print the label. An axis range has a defined relationship to those marks. Those relationships make the figure useful after reconstruction.
The source still determines what we can recover. A printed value and the measured height of a bar can disagree. The application preserves that distinction so an attractive reconstruction does not silently turn an uncertain observation into an asserted fact.
An equation should remain an expression
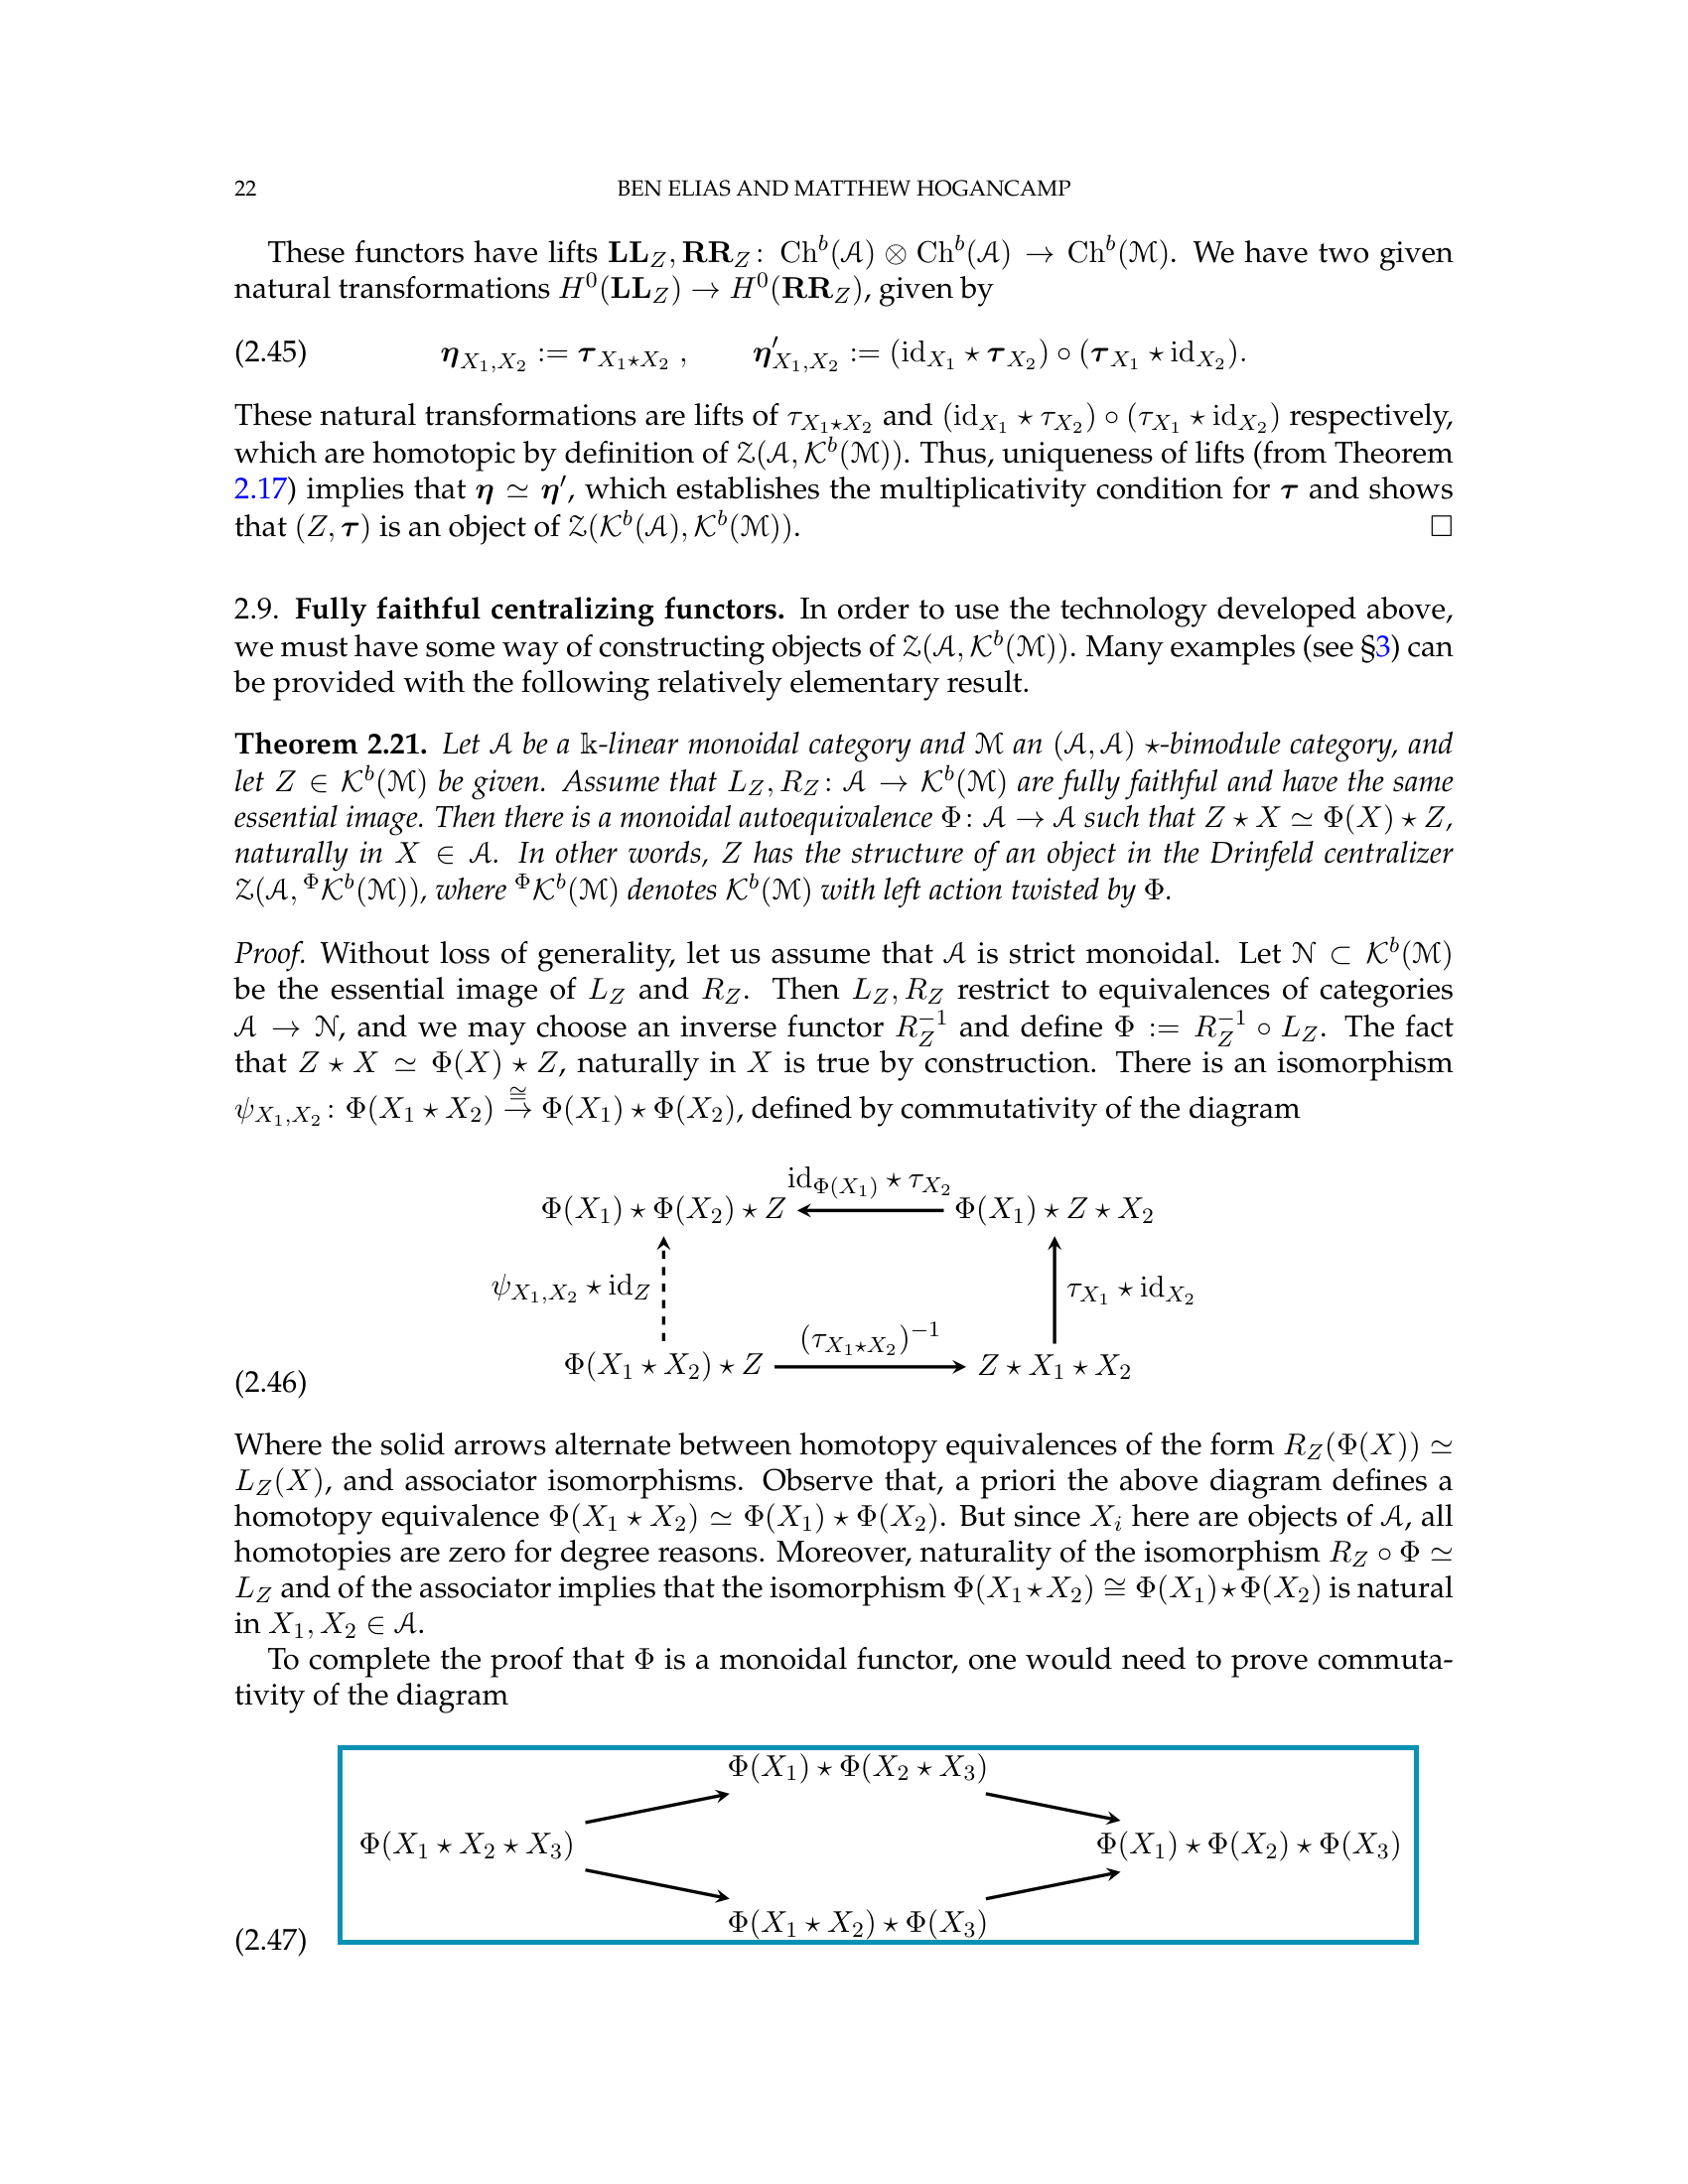
The mathematical diagram contains four complete expressions connected by arrows. Each expression can be selected and edited as a whole. Adding an alpha-squared term causes the mathematical layout to be calculated again, including its superscript.
The first complete expression has a new alpha-squared term. Its mathematical layout is regenerated.
I pushed the construction toward complete expressions because separately positioned symbols would make every edit a typesetting job. The expression gives the mathematical renderer enough structure to do that work. We can preserve the meaning and grouping while accepting small differences in the available typeface.
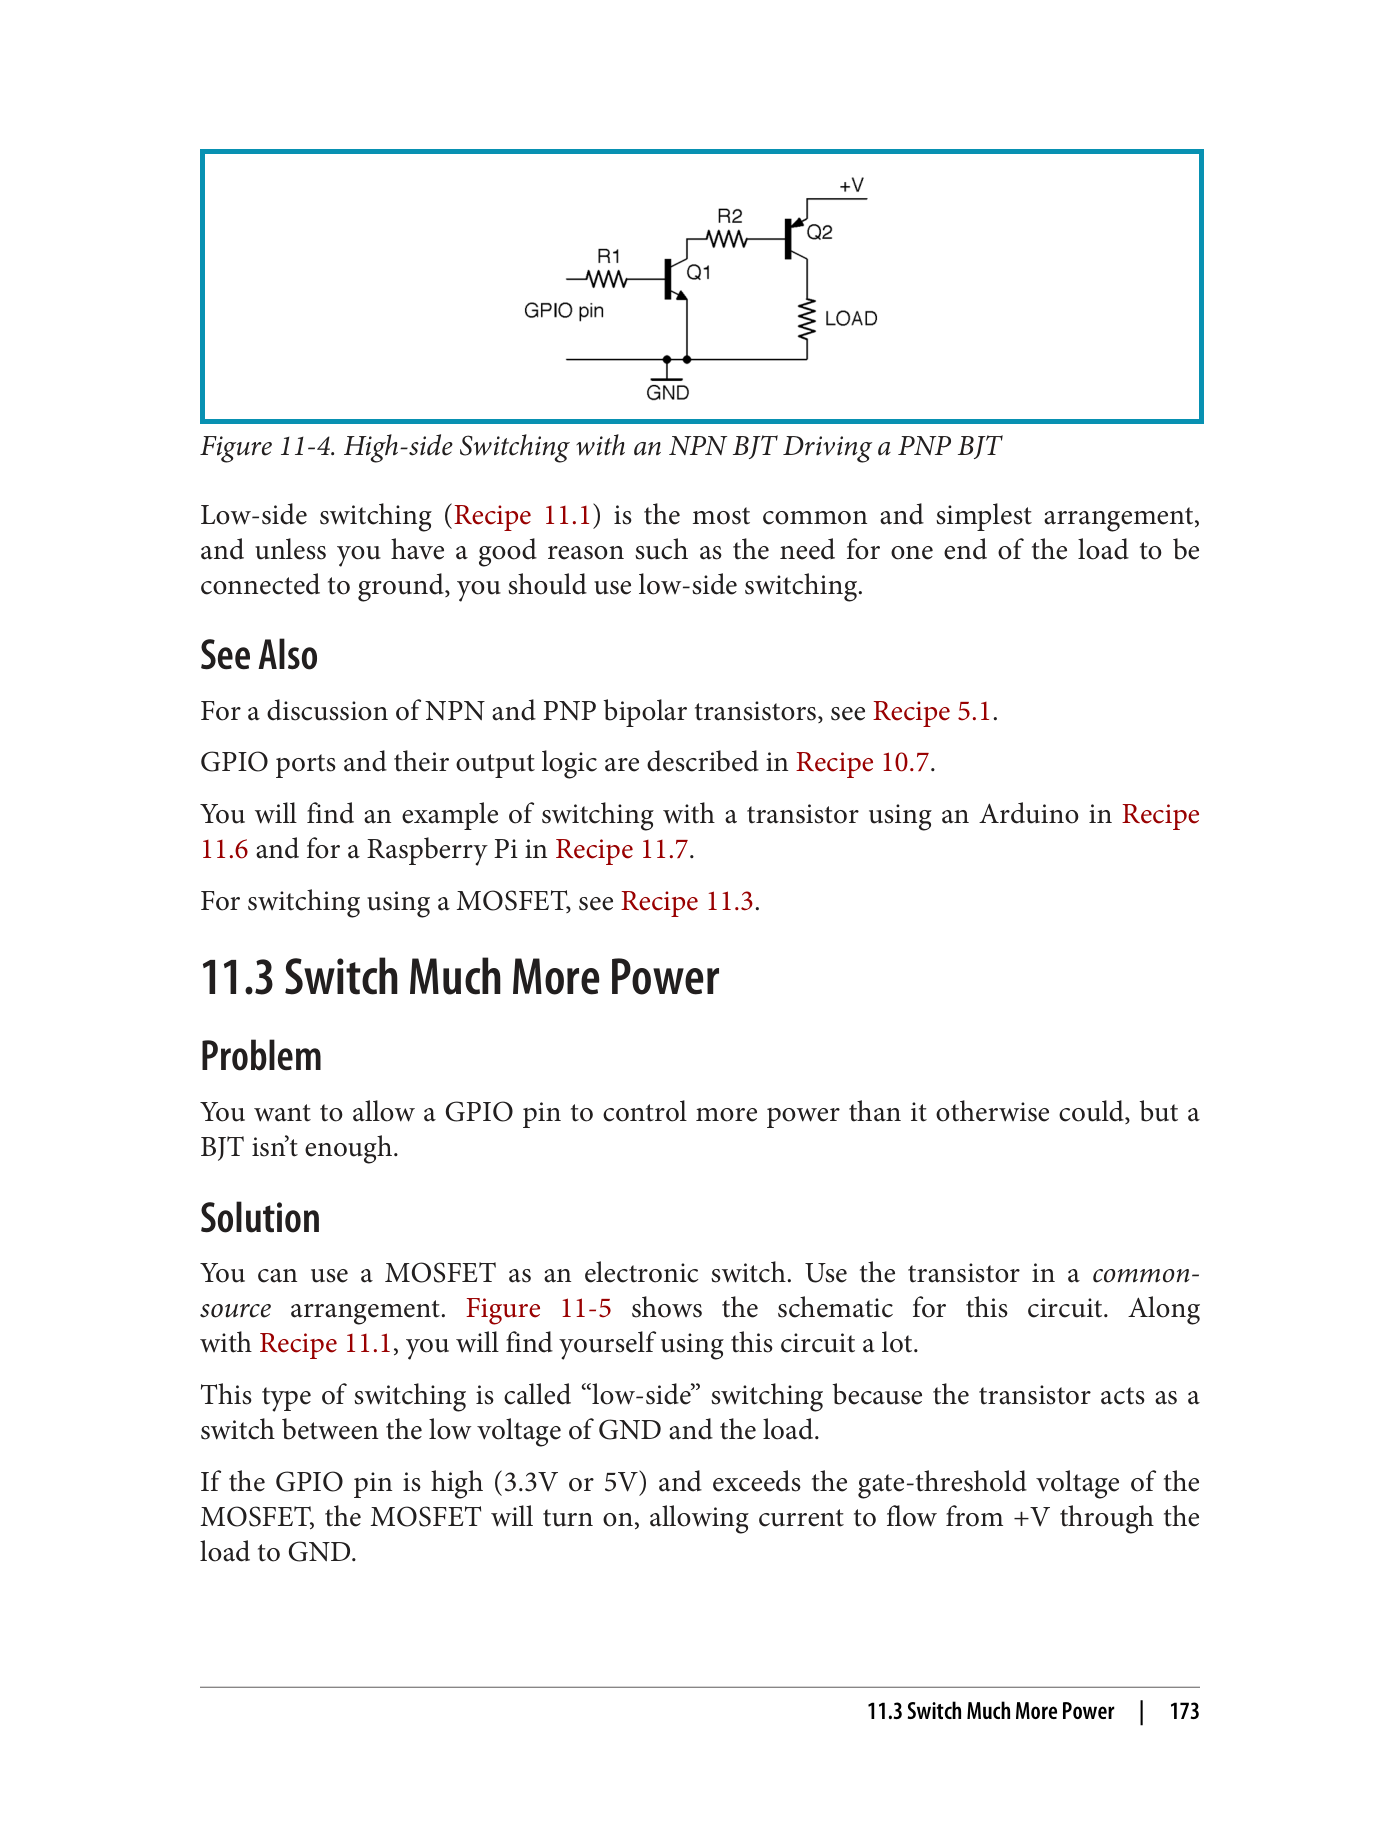
The circuit follows the same principle at a different scale. Its components have named terminals, and the wires connect to those terminals. Moving a resistor carries its attached body and label with it while its wire endpoints follow.
R1 moved right. Its body and label move together and wires still meet its named terminals.
These are drawing relationships. They let us inspect and rearrange the reconstructed circuit without establishing electrical simulation or certification. The useful behavior is specific and visible in these reconstructed examples.
Build understanding into the representation
I approached this as a reconstruction problem with two connected goals: preserve the figure faithfully and recover enough of its meaning to make it useful. The first gives us something we can compare with the scan. The second determines how its parts should behave.
I directed Astra through inspecting the source, rebuilding its appearance and constructing the meaningful objects. The agent used drawing and mathematical tools, rendered the result and compared it with the original. Where an edit exposed a weak representation, we revised the object model or the rendering tool and checked again.
The appropriate tool depends on the figure. A chart needs data and scales. A mathematical diagram needs expressions and their connections. A mechanical illustration needs groups corresponding to its visible parts. The larger document can bring these different representations together while preserving their relationship to the source page.
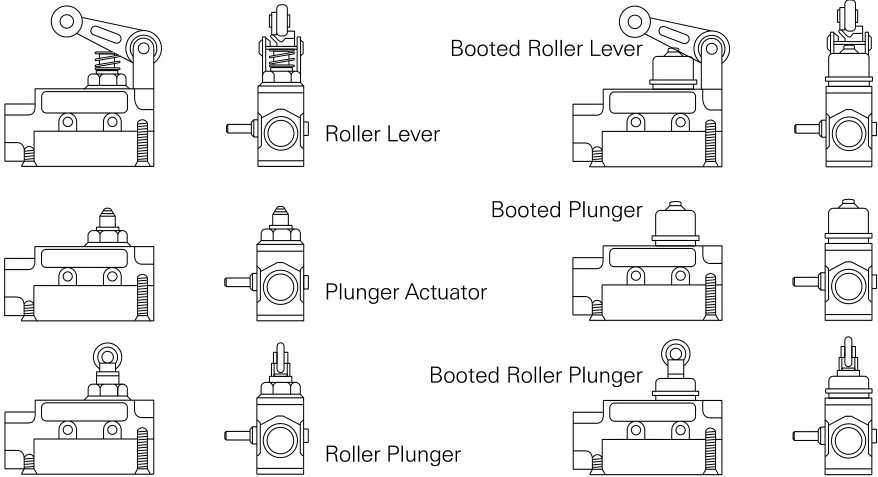
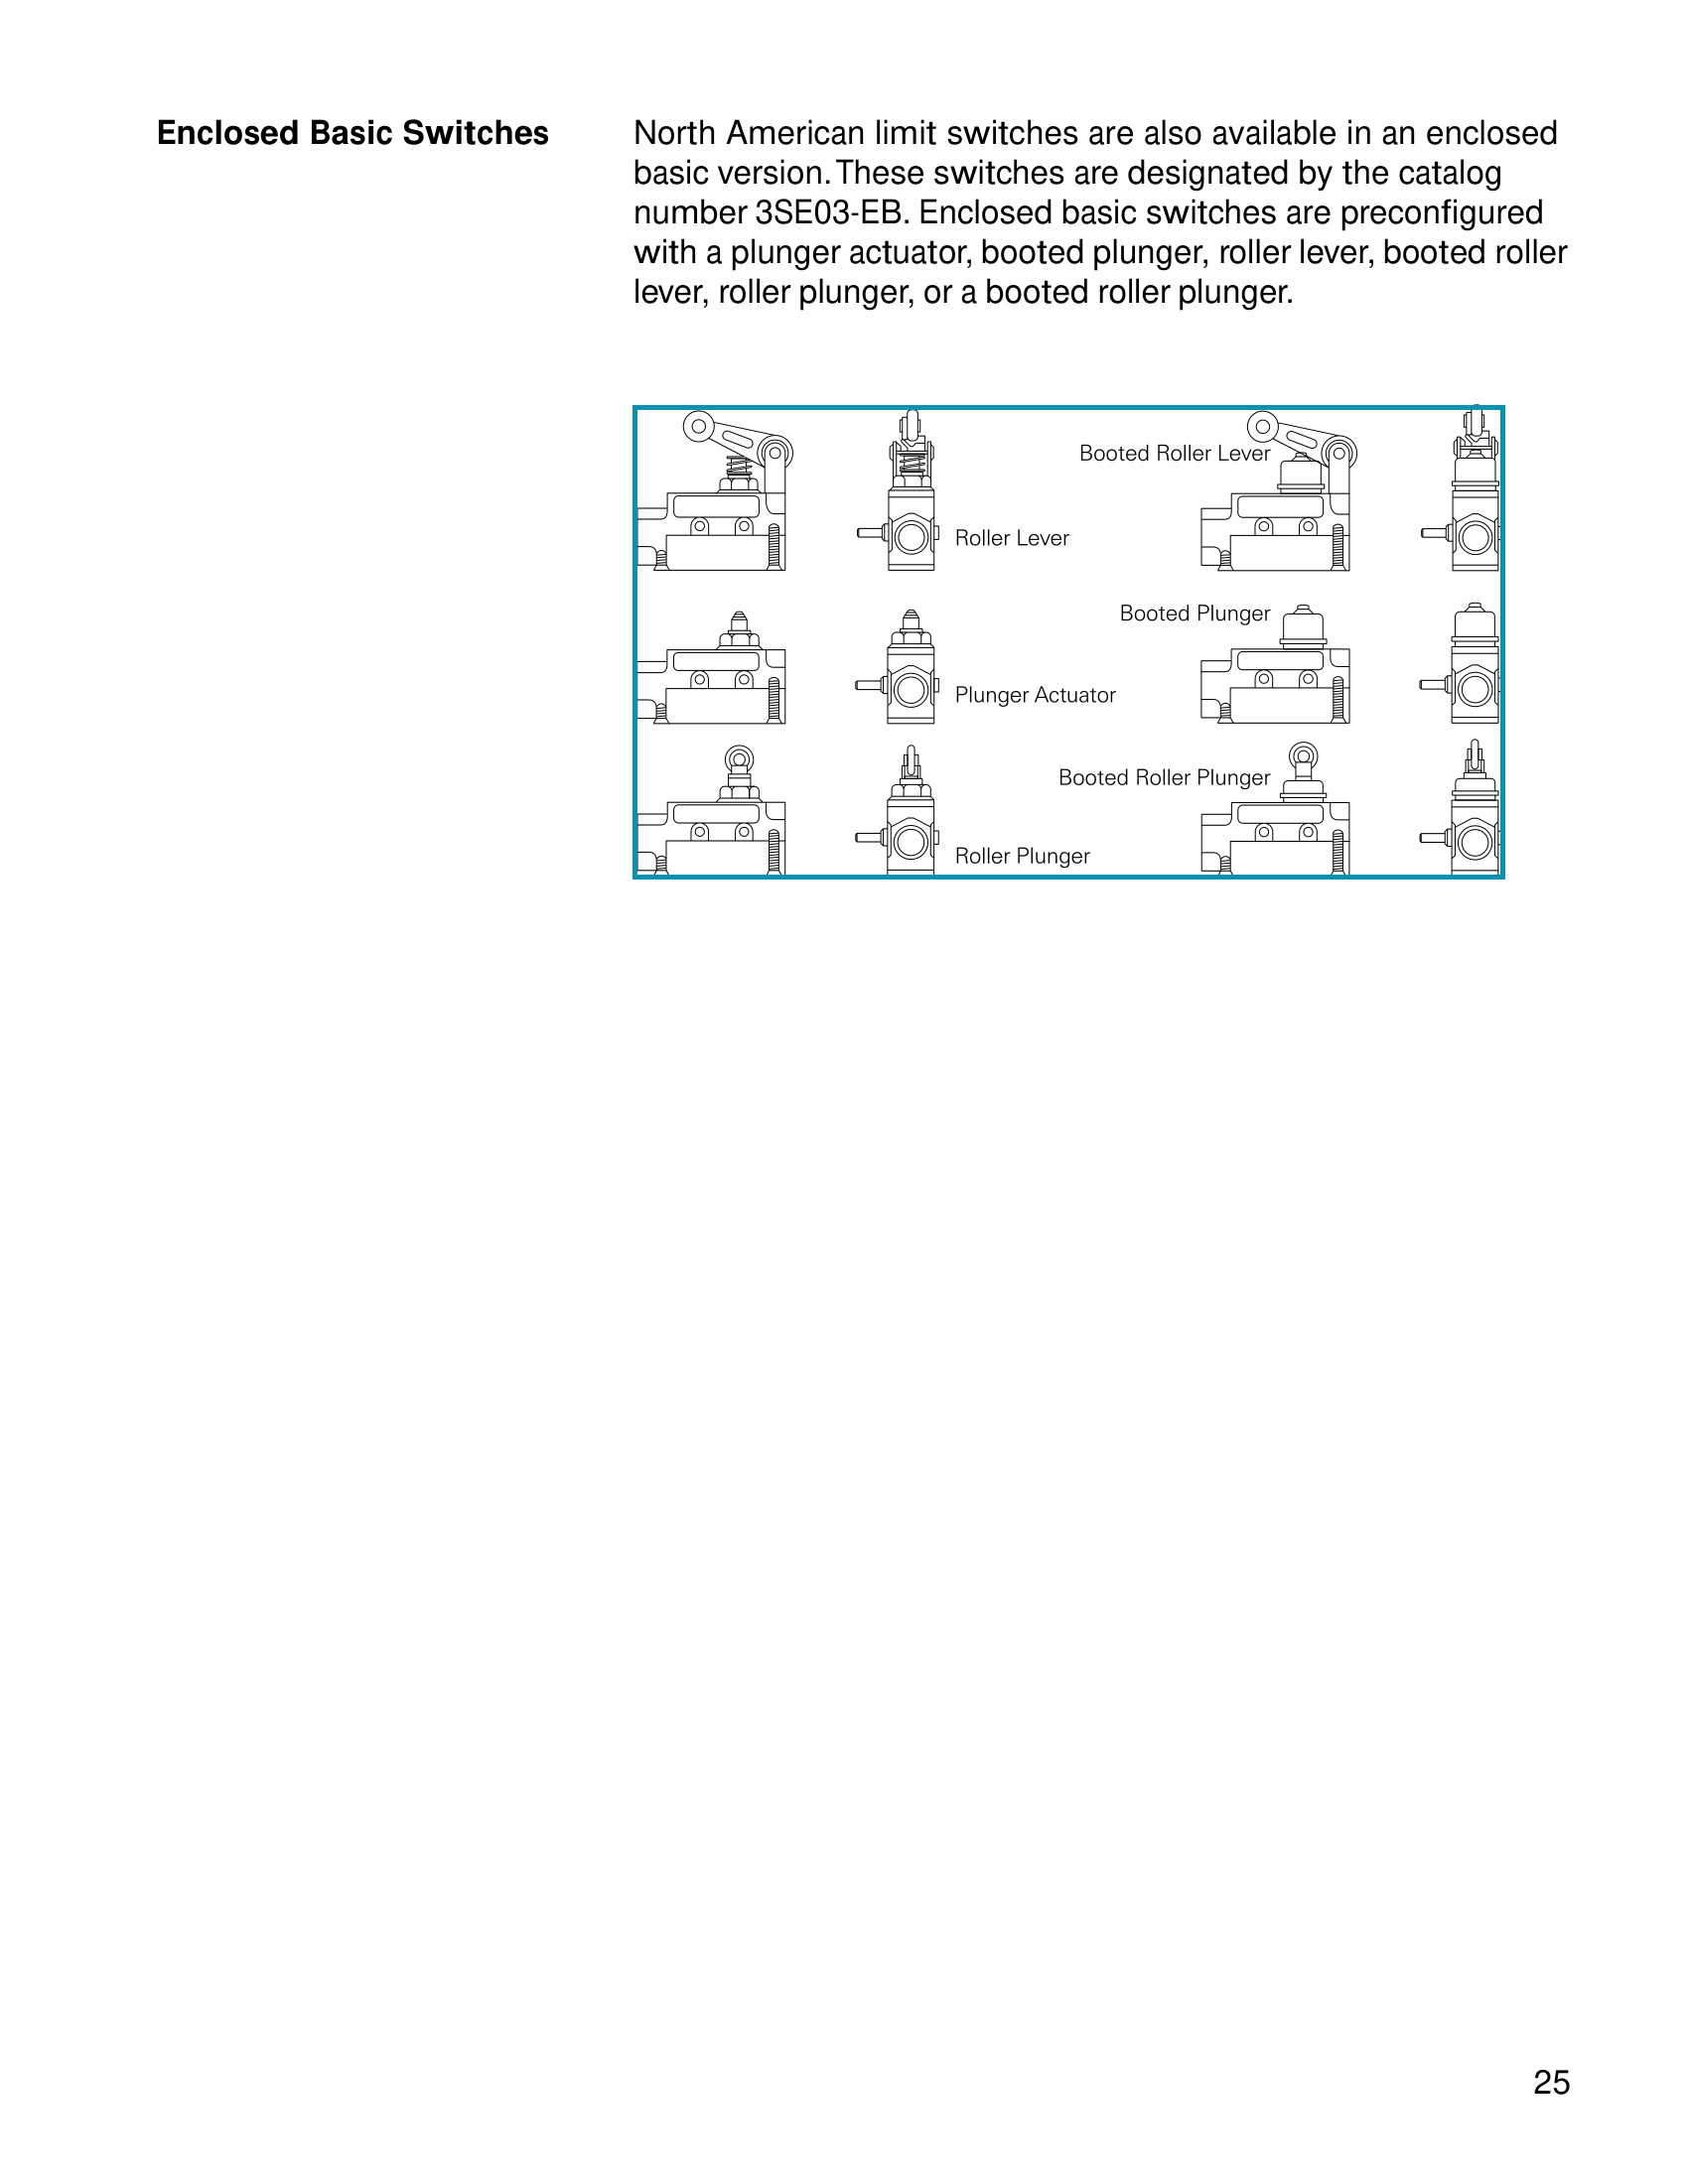
The actuator drawing keeps all six variants and their twelve views together. Its visible parts have meaningful groups, so a roller and its associated contours can move together. Labels are selectable text. Fine spring and thread details remain approximate, and the model represents the visible two-dimensional drawing. It does not supply dimensions or hidden machinery absent from the source.
The exploded pie chart made this distinction particularly clear. Its reconstruction looks close to the source, but some depth faces and labels remain independently drawn. Changing the shares does not yet regenerate the complete illustration. A native chart object needs to own those relationships too. Visual fidelity and editing behavior give us two concrete ways to identify the next improvement.
The reconstruction becomes something you can keep using
The application reconstructed twelve whole technical figures. Each structured project can be saved, exported and reopened. We reopened all twelve selected projects and reproduced their rendered images identically. Rendering and supported edits run locally without asking a model to reconstruct the figure again. The source reconstruction in this study used hosted Astra assistance.
For a technical archive, this opens a substantial opportunity. Someone reading an old publication could work with a chart’s values, reuse an equation or inspect the parts of a drawing while retaining the original page as a reference. The document can carry both its appearance and a useful representation of what it contains.
That is the direction I want to take document reconstruction. We have a working application and concrete examples of the behavior. The next work can expand the figure types and strengthen their native representations against the same visible standard.
Inspect the source pages and reconstructed figures
Original source pages from OmniDocBench. Each outlined page identifies the complete figure selected for reconstruction. The unmarked original is available at full resolution.
Revenue chart
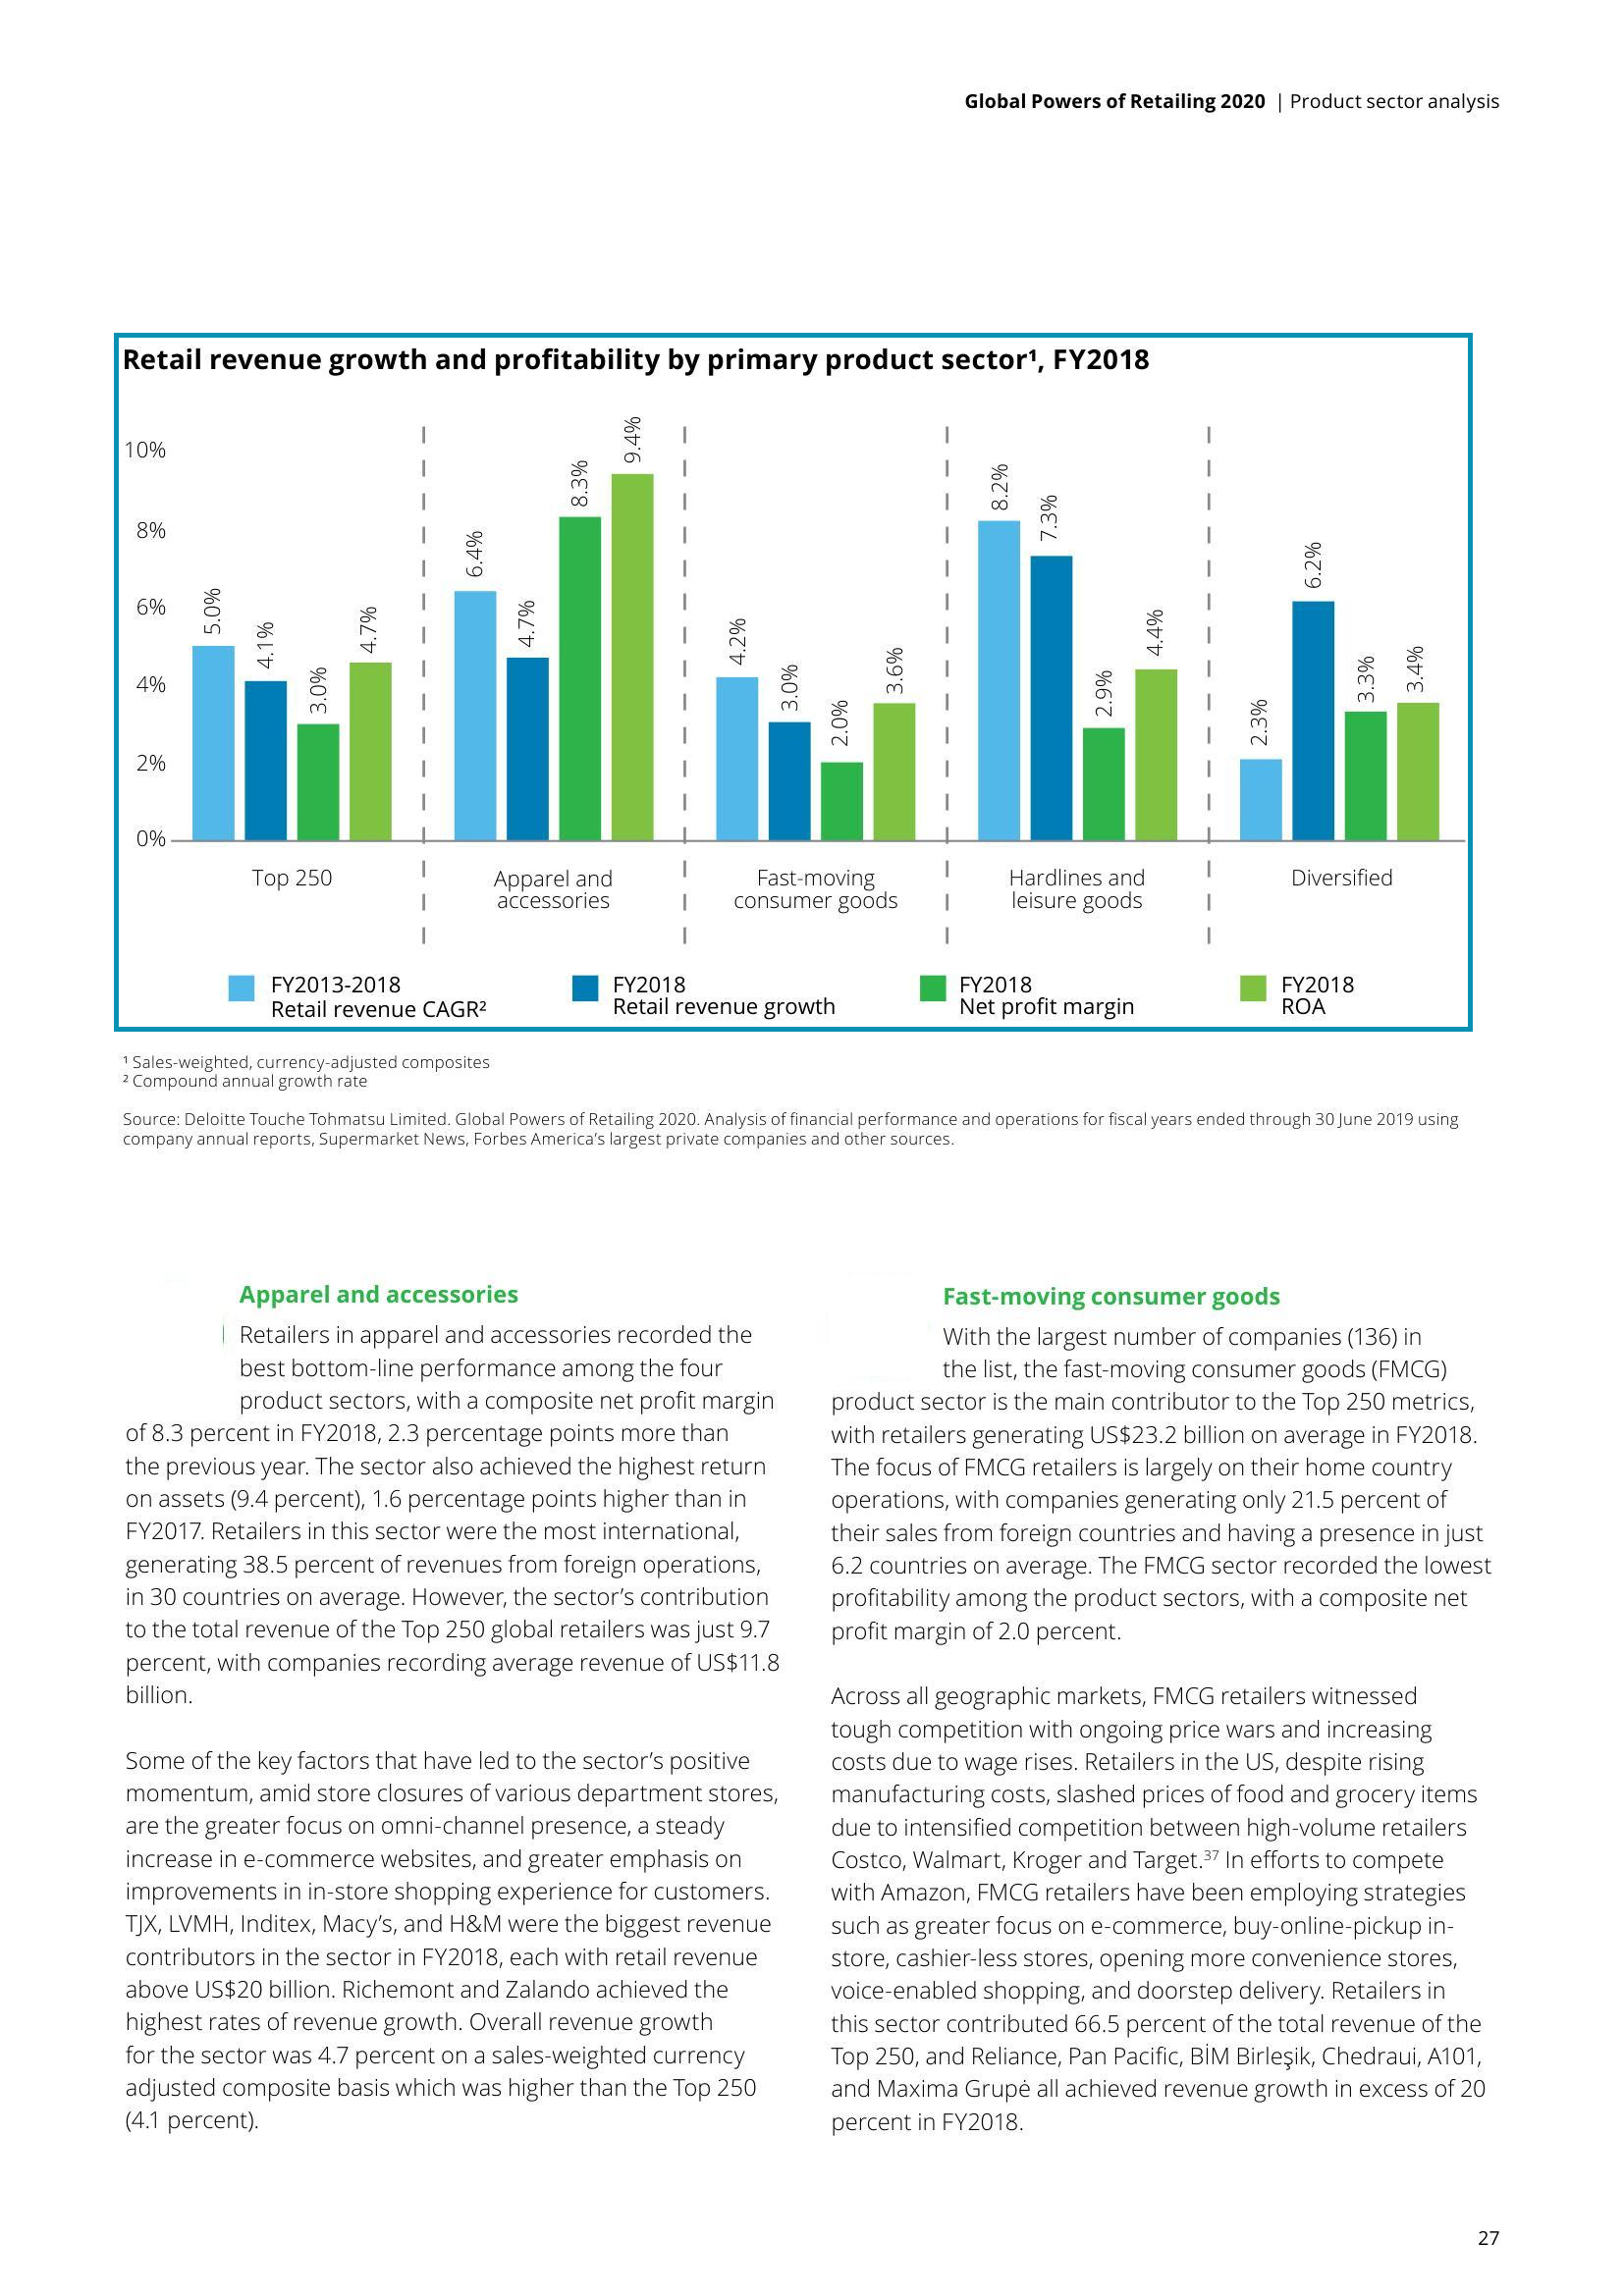
The Top 250 CAGR bar and printed percentage now both represent 6%.
The numeric axes, plotted marks and zero reference use the new scale; recovered values are unchanged.
Open the unmarked original page ↗
| Product sector | FY2013–2018Revenue CAGR² | FY2018Revenue growth | FY2018Net profit margin | FY2018ROA |
|---|---|---|---|---|
| Top 250 | 5.0% | 4.1% | 3.0% | 4.7% |
| Apparel and accessories | 6.4% | 4.7% | 8.3% | 9.4% |
| Fast-moving consumer goods | 4.2% | 3.0% | 2.0% | 3.6% |
| Hardlines and leisure goods | 8.2% | 7.3% | 2.9% | 4.4% |
| Diversified | 2.3% | 6.2% | 3.3% | 3.4% |
Actuator drawing
Mathematical diagram

Circuit drawing

These examples retain their source pages. Complete original books were not supplied.
See the Document Reconstruction work example for the demonstrations together. If your project needs to turn technical documents into usable digital material, let’s discuss it.